Wine Country and Northbay Real Estate Trends
Better Homes and Gardens Real Estate|Wine Country Group Results for March 2024
Better Homes and Gardens Real Estate|Wine Country Group and Better Homes and Gardens Real Estate|Ming Tree enjoyed 50 closings in March 2024 compared to 61 last March and 36 last month. This March we closed homes with a total value of $21 million compared to $25 million last year and $17 million last month. The average selling price of the properties sold by BHGRE|WCG-MT in March was $416,000.
BHGRE|WCG-MT currently has 77 pending sales with a value of $39 million dollars. This is equal to our pending dollar volume at this time last year. We have 116 active listings with a value of $42 million dollars. We are 50% ahead of our volume of last year. Our average listing price is $362,000.
Congratulations to the following BHGRE|Wine Country Group-Ming Tree agents who had one or more closings in the month of March. Jessica Spencer in Clearlake led all agents with five closings. Annalise von Borstel in Eureka had four closings
Chelsie Runnings, Carina De Herrera, Annaliese von Borstel (4), Brian Shea, Bernadette Luna-Notson, Cheryl Marinaro, Elizabeth Gonzalez, Liz Uribe (3), Jana Adams (2), Malachi Herrera (2), Michael Crain, Monica Kangas, Ray Hellgren (2), Rianne Pasquariello (2), Robert Davis, Sandra Riggs, Sheila Deignan, Thomas Harmon (3), Melinda Scalese, Paige Hotchkiss, Liz Manfree, Jessica Hooten (2), Julie Lee, Jessica Spencer (5), Mari Giblin (2) and The Ramos Team.
Congratulations to our Top Producers for the 1st Quarter of 2024:
Jessica Spence – Clearlake – Units and Listings
Jessica Hooten – Clearlake – $ Volume
Paige Hotchkiss – Lakeport – Units and Listings
Carina De Herrera – Lakeport – $ Volume
Parmeeta Ghoman – Petaluma – Units and $ Volume
Mari Giblin – Santa Rosa – Units and Listings
Jana Adams – Santa Rosa – $ Volume
Elizabeth Uribe – Sebastopol – Units
Barbara Cronick – Bodega/Sebastopol – $ Volume
Sheila Deignan – Sonoma – Units
Michael Crain – Sonoma – $ Volume
Annalise von Borstel – Eureka – Units and $ Volume
National Trends
There are more listings, more inventory, and more sales now then there were a year ago. Sales are increasing because inventory is increasing. Buyers have more properties to consider. We are slowly emerging from the “supply constrained market” (seller’s market) where we have been for most of the last decade. With growing inventory, there is less pressure on price appreciation and home price appreciation is now expected to be flat for 2024. The Federal Reserve has softened their forecast of rate reductions for this year until they see better numbers in the economy. This could keep mortgage rates in the 7-8% range for the balance of the year. If rates are stable – the buyers will adjust to that. What scares buyers is volatility in rates.
North Bay Real Estate Trends for March 2024
For all the areas covered by our Multiple Listing Service (BAREIS), which includes Marin, Mendocino, Napa, Solano and Sonoma Counties, there is an inventory of 2,095 homes and condominiums for sale at the end of March. Inventory is up 29% from a year ago (1,629) and it is 15% above the inventory last month (1,825). As is expected, the inventory is beginning to rise into the Spring market. There were 1,097 new sales for the month of March. This number is 6% above a year ago (1,039) and 37% ahead of the pace of last month (802). The median price of homes sold across our North Bay region in March was $719,000 which is 3% above the $699,000 last March.
The “Price Reduction Ratio” (PRR) is considered a leading indicator of future prices for sales and closings. Across the country, approximately 32% of the homes have a price reduction prior to their selling date. The higher the ratio, the more likely price appreciation will be less in the coming months. In normal years, this ratio is in the 30% to 35% range with the higher part of the range being in the Fall months. For March 2024, of all closed homes in our Wine Country markets, our ratios are generally in-line with the national figures. In the region combined, 27% of the homes sold in March had a price reduction prior to selling. This compares to 30% last month and 32% a year ago. The numbers were 24% for Napa County, 22% for Sonoma County and 36% for Mendocino County. Conversely, the ratio of homes selling for more than the original asking price was also 27% across the region. This compares to 26% last month and 24% a year ago. The numbers were 24% in Napa County, 43% in Sonoma County and 15% in Mendocino County. Twenty-seven percent of the homes in the region had a price reduction prior to selling while 58% had a lower selling price than the original list price upon closing.
Sonoma County: The inventory of homes and condominiums available in Sonoma County at the end of March stands at 556 homes. This is 32% above the inventory in March 2023 (422) and it is 19% above the inventory last month (468). We are experiencing the expected rise in inventory leading into the Spring market. Fifty-four percent of the available homes for sale in Sonoma County (300) currently are priced at $1,000,000 or more. New sales (329) in Sonoma County in March were 3% above the pace of March 2023 (320) and they were 29% above the pace last month (255). There is a 1.7-month supply of inventory based on the current sales pace. The time it takes to sell a home in the various areas of Sonoma County (Days on Market) varies from 9 (Coastal Sonoma) to 106 (Cloverdale) days. For our MLS (BAREIS) “Days on Market” represents the time from when the property is first listed in the MLS to the date the property goes into “pending” (all conditions removed) status. On average, it can take anywhere from 0 to 30 additional days for properties to close after going pending. The average Days on Market for all the County is 53 days. The median price of the 299 homes closed in March in Sonoma County was $816,000. This is 3% above the median price in March 2023 ($795,000). The annualized average price ($1,019,780) of all homes sold in the County also increased 3% in the past twelve months. Over the past four months, Sonoma County homes are selling at 95% of their original list price. In March, 43% of the homes in Sonoma County sold at a price more than the original asking price and 22% of the homes had a reduction in price before they sold. Forty-two percent of the homes closed last month had a lower selling price than the original list price.

Sonoma County Luxury Homes: About one quarter of the inventory in Sonoma County can be characterized as Luxury Homes (listing price more than $2,500,000 (up from $2,000,000 last month). There has been a 6% increase in the number of Luxury Homes closed (163) from 4/1/23 to 3/31/24 compared to 145 closings in the period 4/1/22 to 3/31/23. This is the first increase in year over year luxury home sales in the past couple of years. The inventory of luxury homes (138) is 59% above the inventory in March 2023 (87 homes) and it is 50% above the inventory last month (92). The pace of new sales (12) in March is just below last year’s pace (13) and it is 100% above the sales pace last month (6). The Days on Market for 10 Luxury Home closings was 80 days this March. The Days on Market for all closed properties in the County in March was 53 days. There is a 11.5-month supply of inventory of luxury properties based on the current sales pace compared to a 1.7-month supply in the overall Sonoma County market. Over the past four months, Sonoma County Luxury Homes are selling at roughly 90% of original list price.
Coastal Sonoma: There are 11 homes and condominiums available in Coastal Sonoma (Bodega Bay, Jenner and Stewart’s Point). This compares to 10 homes in inventory in March 2023 and 11 homes last month. There were 4 new sales in March compared to four a year ago and one last month. The Days on Market for the 2 homes that closed in March is just 9 days.
Healdsburg Trends: There are 57 homes and condominiums available for sale in Healdsburg at the end of the month. This is 50% above the inventory in March 2023 (38) and it is 19% above the inventory last month (48). New sales in March (21) were 17% above the pace of sales in March 2023 (18) and they were 163% above the pace of sales last month (8). There are 2.7-months of available inventory based on the current sales pace. The Days on Market for the 15 homes that closed in March is 43 days.
Oakmont: There are 14 homes and condominiums available in Oakmont at the end of March. This is 18% below the inventory in March 2023 (17) and it is 22% below the inventory of last month (18). New sales (25) were 32% above the sales pace of a year ago (19) and they were 92% above the pace of last month (13). There were 25 new sales in the month when the month started with 18 units in inventory. There is less than a one-month (0.6-month) supply of inventory based on the current sales pace. The median price of the homes sold in Oakmont in the past year has ranged from the low $600,000’s up to $832,000. The median price was $630,000 for the 14 homes that closed in March. The Days on Market for the homes that closed in March is 44 days.
Petaluma: The inventory of homes and condominiums for sale in Petaluma at the end of March (56) is 17% above the inventory in March 2023 (48) and it is equal to the inventory last month (56). There were 46 new sales for the month. This is 28% above the sales in March 2023 (36) and it is 31% above the sales pace last month (35). The Petaluma market currently has 1.2 months of available inventory based on the current sales pace. The median price of the 48 homes that closed in March was $927,000. This is 11% above the median price last March ($838,000). The Days on Market for the homes that closed in March is 42 days.
Rohnert Park: The inventory of homes and condominiums for sale in Rohnert Park at the end of March (31) is 82% above the inventory in March 2023 (17) and it is 121% above the inventory last month (14). There were 24 new sales in Rohnert Park in March. This sales pace is just below the 25 sales in March 2023 and it is 14% below the sales last month (28). There is a 1.3-month supply of inventory based on the current sales pace. The median price ($724,000) of the 28 homes and condominiums that closed in March is about 1% above the median price in March a year ago ($720,000). Days on Market for the homes that closed in March is 43 days.
Russian River: The inventory of homes and condominiums for sale at the end of March in the Russian River area (Guerneville, Monte Rio and Rio Nido) (32) is 45% above the level of March 2023 (22) and it is 7% above the inventory last month (30). There were 16 new sales for the month of March. This is 78% above the pace in March 2023 (9) and it is also 78% ahead of the pace last month (9). There is a 2-month supply of inventory in the Russian River based on the current sales pace. The median price in the Russian River has ranged from about $500,000 to $725,000 over the past year. The median was $800,000 for the 10 homes that closed in March. The homes that closed in the Russian River in March went from listing to pending in 88 days.
Santa Rosa: Thirty-five percent of the available inventory in Sonoma County is in the City of Santa Rosa. The inventory of homes and condominiums for sale in the City of Santa Rosa at the end of March (192) is 24% above the inventory of a year ago (155) and it is 15% above the inventory last month (103). New sales in March (135) are 3% below the pace of last March (139) and they are 31% above the 103 sales last month. There is 1.4-month supply of available homes in Santa Rosa based on the current sales pace. The median price of the 115 homes closed in March in Santa Rosa was $760,000 which is 3% above the $740,000 price a year ago. The Days on Market for the homes that closed in March is 53 days.
Sebastopol Trends: The inventory of homes and condominiums for sale at the end of March in Sebastopol is 30 homes. This is 11% above the inventory last March (27) and it is 30% above the inventory last month (23). There were 14 new sales for the month of March. This is 30% below the pace in March 2023 (20) and it is 13% below the pace last month (16). There is a 2.1-month supply of inventory in Sebastopol based on the current sales pace. The 12 homes that closed in Sebastopol in March went from listing to pending in 71 days.
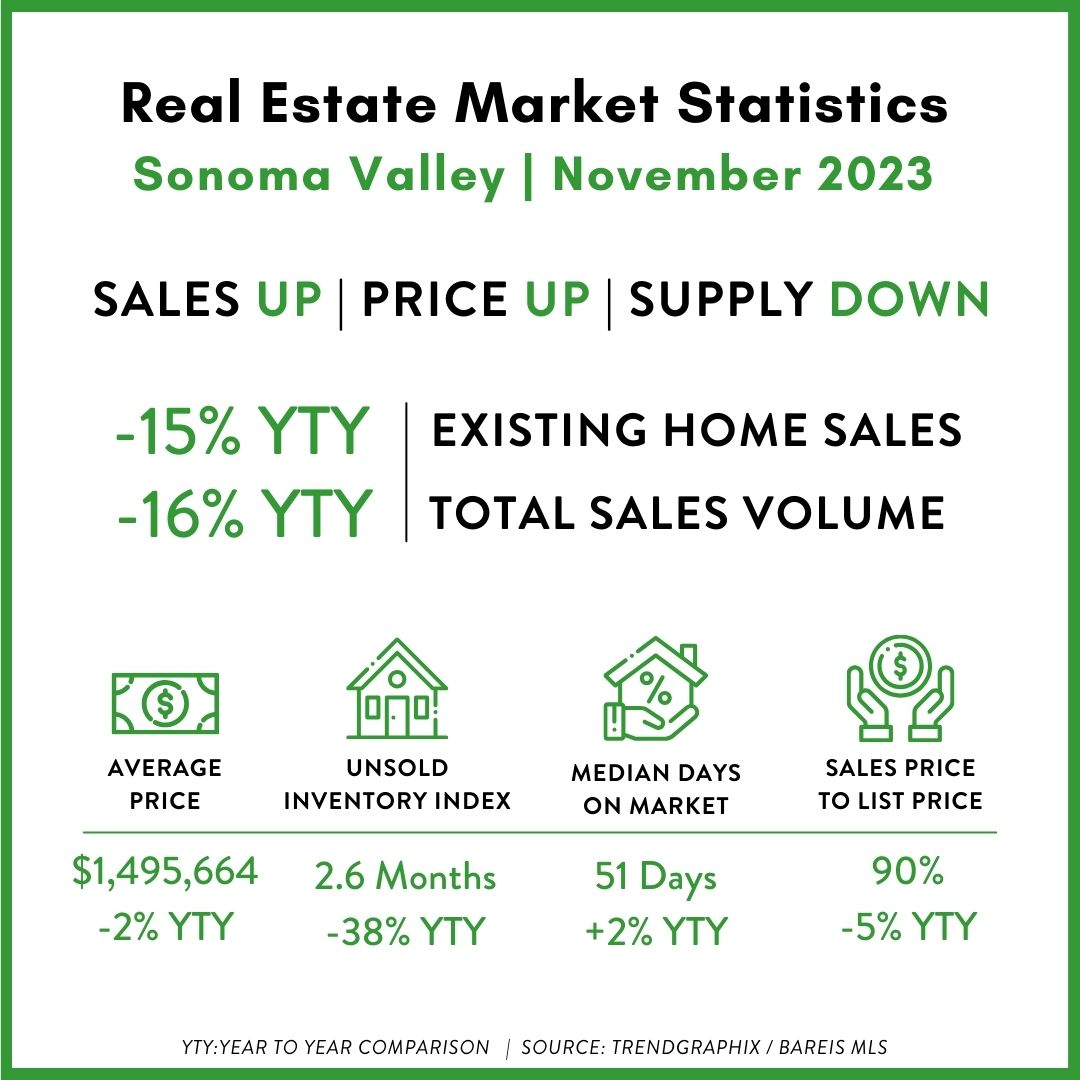
Sonoma Valley: The number of available homes and condominiums for sale (92) at the end of March in the Sonoma Valley (Sonoma, Glen Ellen and Kenwood) is 35% above the inventory last March (68) and it is 31% above the inventory of last month (70). There were 35 new sales for the month. This is 5% below the 37 sales in March 2023 and it is 59% above the 22 sales last month. There is a 2.6-month supply of inventory in Sonoma based on the current pace of sales. The average Days on Market for the 28 properties that closed in the Sonoma Valley in March is 62 days. The closings in the month had a selling price equal to 96% of the original listing price. In March, 37% of the homes in the Sonoma Valley sold at a price more than the original list price and 26% had a reduction in price before they sold. Fifty-one percent of the homes in the Valley had a lower selling price than the original list price.
The high-end quartile (top 25%) of inventory in the Sonoma Valley at the end of March starts at $3,700,000 (up from $3,400,000 last month). Twenty-two homes closed in the top quartile in the past twelve months compared to 21 in the twelve months prior to that. In March, there was one new sale in this quartile comparing to 1 new sale a year ago and 1 new sale last month. There are 22 homes available in this quartile in March 2024 compared to 19 a year ago and 15 last month.

Windsor: The inventory of homes and condominiums for sale in Windsor at the end of March is 8 properties. This is 47% below the inventory in March 2023 (15) and it is 43% below the 14 homes in inventory last month. There were 15 sales in the month. This is 29% below the pace of sales in March 2023 (21) and it is equal to the pace of last month (15). There is a 0.5-month supply of inventory based on the current sales pace. The days on market for the 20 homes that closed in March 2024 in Windsor is 45 days. The median price ($820,000) of the homes closed in Windsor in March compares to a median price of ($815,000) a year ago, an increase of less than 1%.
Mobile Homes in Sonoma County: The inventory of available mobile homes for sale in Sonoma County at the end of March is 61 homes. This is 8% below the number of mobile homes available in March 2023 (66) and it is 7% above the number of available mobile homes last month (57). There were 24 new mobile home sales in March. This is 14% below the pace of sales in March 2023 (28) and it is 33% above the pace of sales last month (18). There is a 2.5-month supply of inventory based on the current sales pace. The average days on market of the 20 mobile homes closed in March is 84 days and the median price was $190,000 compared to $215,000 a year ago and $191,000 last month.
Lots for Sale and Sold in Sonoma County: The inventory of available lots for sale in Sonoma County at the end of March is 305 properties. The current inventory is 17% above the number of lots in March 2023 (261) and it is 8% above the number of available lots last month (282). There were 41 new lot sales in March. This is 86% above the pace of sales in March 2023 (22) and it is 64% above the pace of lot sales last month (25). There is a 9.2-month supply of inventory based on the current sales pace. The average days on market of the 28 lots closed in March is 133 days and the median price is $405,000 compared to $400,000 a year ago and $355,000 last month.
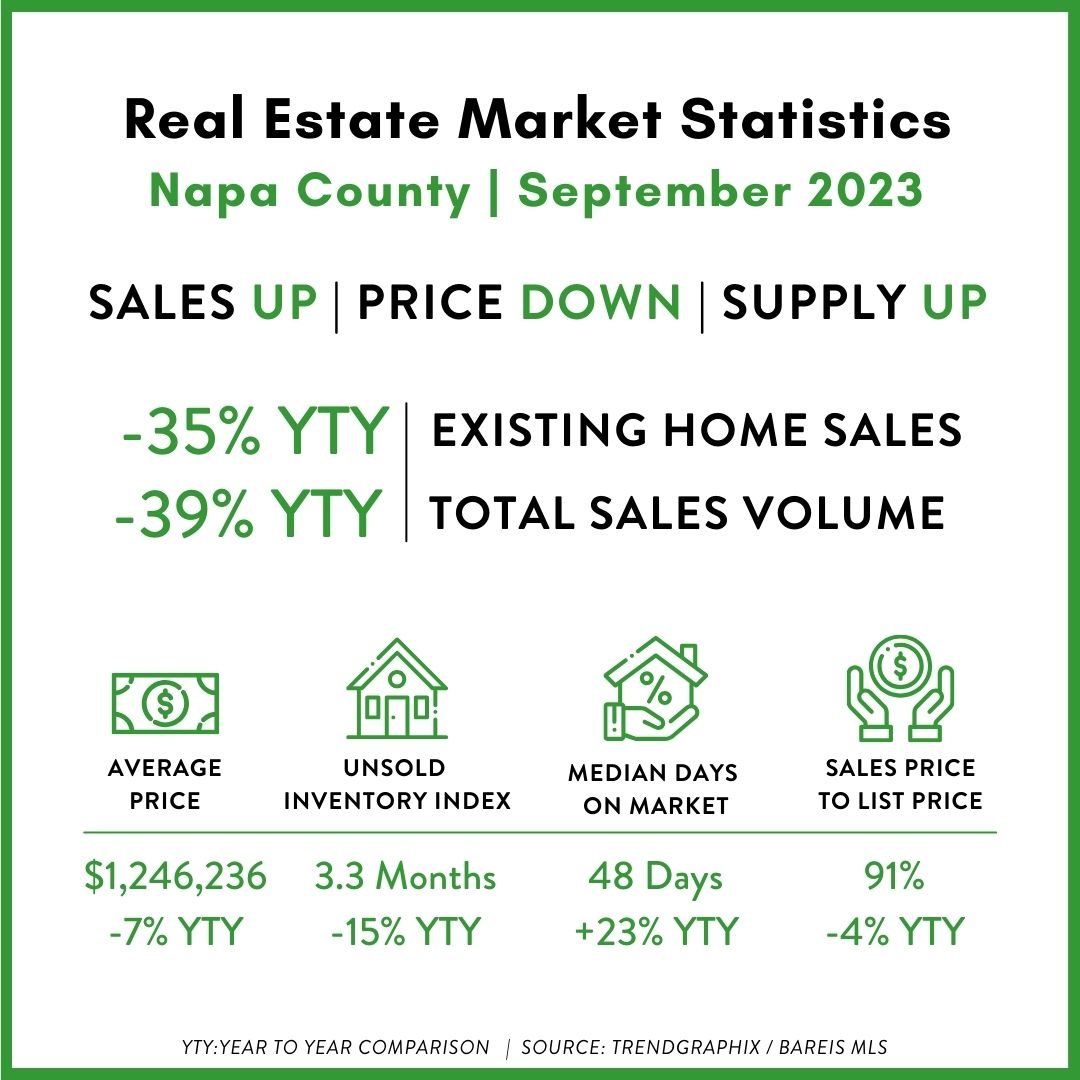
Napa County: The inventory of homes and condominiums available for sale in Napa County at the end of March (248) is 18% above the inventory in March 2022 (210) and it is also 18% above the inventory last month (210). New sales (101) were 15% above the pace of last year (88) and are 58% ahead of the sales last month (64). There is a 2.5-month supply of inventory based on the current sales pace. The Days on Market for the homes closing in Napa County is currently 72 days. In our MLS (BAREIS) “Days on Market” represents the time from when the property is first listed in the MLS to the date the property goes into “pending” (all conditions removed) status. On average, it can take anywhere from 0 to 30 additional days for properties to close after going pending. The median price of the 70 homes closed in March in Napa County ($866,000) is 2% above the median price of a year ago ($851,000). The annualized average price ($1,222,023) of all homes sold in the County decreased 11% in the past twelve months. Over the past four months, Napa County homes are selling at roughly 92% of original list price. In March, 24% of the homes in Napa County sold at a price that was more than the original asking price and 24% of sold homes had a price reduction prior to sale. Sixty-one percent of the homes sold at a price that was less than the original asking price.

Napa County Luxury Homes: If one takes the highest quartile (25%) of available inventory as the “Luxury Market”, the Luxury Market currently begins at $3,450,000 in Napa County. There has been a decrease of 37% for the number of closings (33) of Luxury Homes (sales price more than $3,450,000) in Napa County for the period 4/1/23 to 3/31/24 compared to 52 closings in the period 4/1/22 to 3/31/23. The Napa luxury market does not seem to be responding as quickly as the Sonoma County luxury market. There are 62 luxury homes in inventory at the end of March 2024 compared to 73 homes in inventory at the end of March 2023 and 50 last month. There were 6 new Luxury Home sales in March compared to 4 last year and 2 last month. This creates a 10.3-month supply of inventory. Over the past four months, Napa County Luxury Homes are selling at roughly 87% of original asking price and the 3 homes that closed last month were on the market for 95 days.
American Canyon: There are 11 available homes and condominiums in inventory at the end of March in American Canyon. Last year there were 18 homes in inventory and there were 6 homes in inventory last month. There were 7 new sales in the month. This compares to 16 new homes sales last March and 5 new sales last month. There is a 1.6-month supply of inventory based on the current sales pace. The Days on Market for 4 homes that closed in American Canyon last month was 17 days. The median price in American Canyon has ranged from about $500,000 to $800,000 over the past year. The median was $673,000 in March.
Napa: Fifty-six percent of the inventory in Napa County is in the City of Napa. There are 138 available homes and condominiums in inventory at the end of March in the City of Napa. This is 53% above the supply at the end of March 2023 (90) and it is 13% above the inventory at the end of last month (122). New sales (75) were 37% above the pace of March 2023 (56) and they were 62% above the pace of last month (47). There is a 1.8-month supply of inventory based on the current sales pace. The Days on Market for the 49 closings last month is 57 days. The median price of the homes that closed in the City of Napa in March was $880,000. This is 4% below the median price of the homes closed in March 2023 ($913,000).
Up Valley Napa County: The inventory of homes and condominiums for sale in the Up Valley Napa County market (Angwin, Calistoga, Deer Park, Oakville, Rutherford, St. Helena and Yountville) at the end of March (86) is 6% above the level of 81 in March 2023 and it is 27% above the inventory last month (68). There were 17 new sales this month compared to 15 a year ago and 9 last month. There is now a 5.1-month supply of inventory based on the current sales pace. The Days on Market for the 15 closings last month is 141 days. Over the past four months, Up Valley homes are selling at roughly 87% of original list price. Forty-one percent of the Luxury Market inventory (price more than $3,450,000) in Napa County is in the Up Valley Market (31 homes). There was one luxury home (price more than $3,450,000) closing in the Up Valley Market last month and there were 3 new luxury home sales.
Angwin: The inventory of homes and condominiums for sale in the Angwin at the end of March (11) compares to 8 in March 2023 and 7 last month. There was 1 new sale this month compared to two a year ago and one last month. The average asking price for the 11 homes on the market in Angwin is $3,790,000.
Mobile Homes in Napa County: The inventory of available mobile homes for sale in Napa County at the end of March is 32 homes. This is 28% above the number of mobile homes available in March 2023 (25) and it is just above the 31 available homes last month. There were 14 new mobile home sales in March. This compares to 15 home sales last March 2023 and 9 sales last month. There is a 2.3-month supply of inventory based on the current sales pace. The average days on market of the 9 mobile homes closed in March is 142 days and the median price was $219,000. This compares to a median price of $270,000 in March 2023 and $275,000 last month.
Mendocino County: The inventory of homes and condominiums available in Mendocino County at the end of March stands at 242. This is 10% above the inventory in March 2023 (221) and it is 5% above the inventory last month (230). New sales (54) in Mendocino County in March were 80% above the pace of March 2023 (30) and they were 10% above the pace last month (49). There now is a 4.5-month supply of inventory in Mendocino County based on the existing sales pace. The average Days on Market for the 47 homes sold in Mendocino County in March is 99 days. For our MLS (BAREIS) “Days on Market” represents the time from when the property is first listed in the MLS to the date the property goes into “pending” (all conditions removed) status. On average, it can take anywhere from 0 to 30 additional days for properties to close after going pending. The median price of sold homes in Mendocino has been between $400,000 and $600,000 over the past year. The median price of the homes closed in March in was $369,000. Over the past four months, Mendocino County homes are selling at roughly 87% of original asking price. In March, 15% of the homes in Mendocino County sold at a price greater than the original asking price. Thirty-six percent of the homes showed a price reduction prior to selling and 70% of homes closed at a price less than their original list price.

Ukiah: The inventory of homes and condominiums for sale at the end of March in Ukiah is 40 homes. This is 11% below the level of March 2023 (45) and it is 11% above the inventory last month (36). There were 12 new sales for the month of March. This compares to 12 sales in March 2023 and 13 sales last month. There are 3.3-months of inventory based on the current sales pace. The average Days on Market for the 10 homes sold in Ukiah in March is 100 days. The median price of the homes sold in Ukiah in the past year has ranged from $450,000 to $640,000. The median price was $432,000 for the homes that closed in March.
Redwood Valley and Calpella: The inventory of homes for sale at the end of March in Redwood Valley and Calpella is 15 homes. This compares to 21 homes in March 2023 and 15 homes last month. There were 8 new sales for the month of March. This compares to 2 sales in March 2023 and 8 new sales last month. There is a 1.9-month supply of inventory based on the current sales pace. The median price of the homes sold in Redwood Valley/Calpella in the past year has ranged from $400,000 to $725,000. The 4 closings in Redwood Valley/Calpella in March sold for $436,000 and the home sold in 75 days.
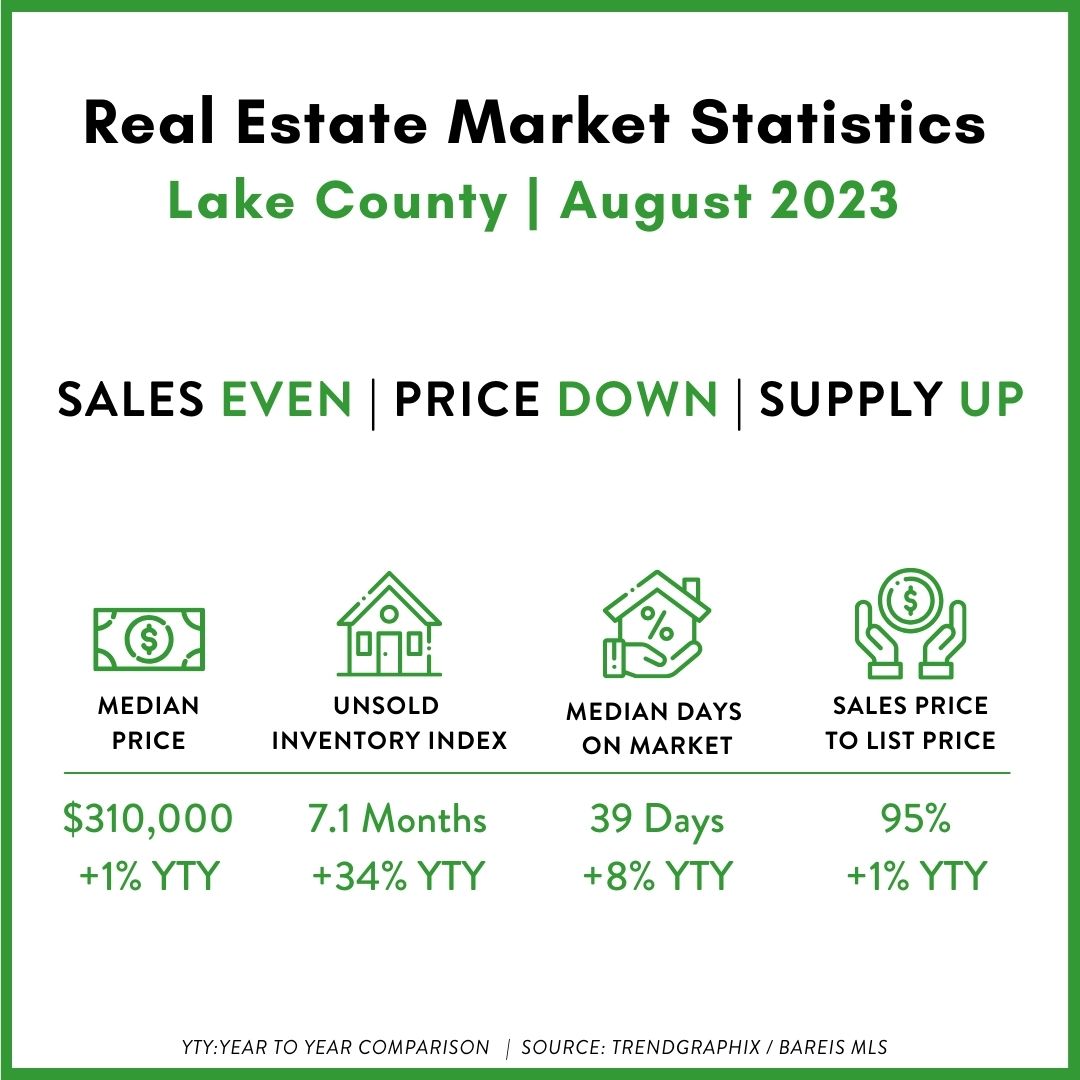
Lake County: The inventory of homes and condominiums available in Lake County at the end of March stands at 405. Approximately 36% of the inventory (145 homes) is in the communities of Clearlake and another 11% (46 homes) are in Lakeport. The countywide inventory is 7% above the inventory in March 2023 (379) and it is also 7% above the inventory last month (378). Closed sales (71) in Lake County in March were 14% below the pace of March 2023 (83) and they were 27% ahead of the pace last month (56). There now is a 6.2-month supply of inventory in Lake County based on the existing closings pace. The median Days on Market for the homes sold in Lake County in March is 67 days. Usually “Days on Market” are traced from listing date to pending date, so the closing date would be somewhat longer. The median price of the homes closed in March in Lake County was $300,000. This is 9% below the median price in March 2023 ($331,000) and it is 5% above the median price last month ($286,000). The homes sold in Lake County last month sold at an average of 96% of original list price.

Humboldt County: There are 325 active listings in Humboldt County as of 3/31/24. They have a median list price of $425,000 and an average list price of $545,410. There were 69 closings in the month of March. They had a median sold price of $424,945 and an average sold price of $525,857. They sold for 91% of original list price and had an average days on market of 62 days.
Marin County: Marin County is often considered a “feeder” county to our North Bay Wine Country markets. Marin County’s inventory (301 homes) is 15% above the 261 homes in March 2023 and it is 21% above the 248 homes in inventory last month. New sales (209) were 10% above the number last March (190) and they were 83% above the pace of last month (114). There is a 1.4-month supply of inventory at the end of March 2024. The median price of the 142 homes sold in Marin County in March is $1,450,000. This is 10% above the median price a year ago ($1,316,000). Homes sold in an average of 35 days and at 102% of original asking price.